Plavisto
Wierzbicki Lab Plastid Genome Visualization Tool
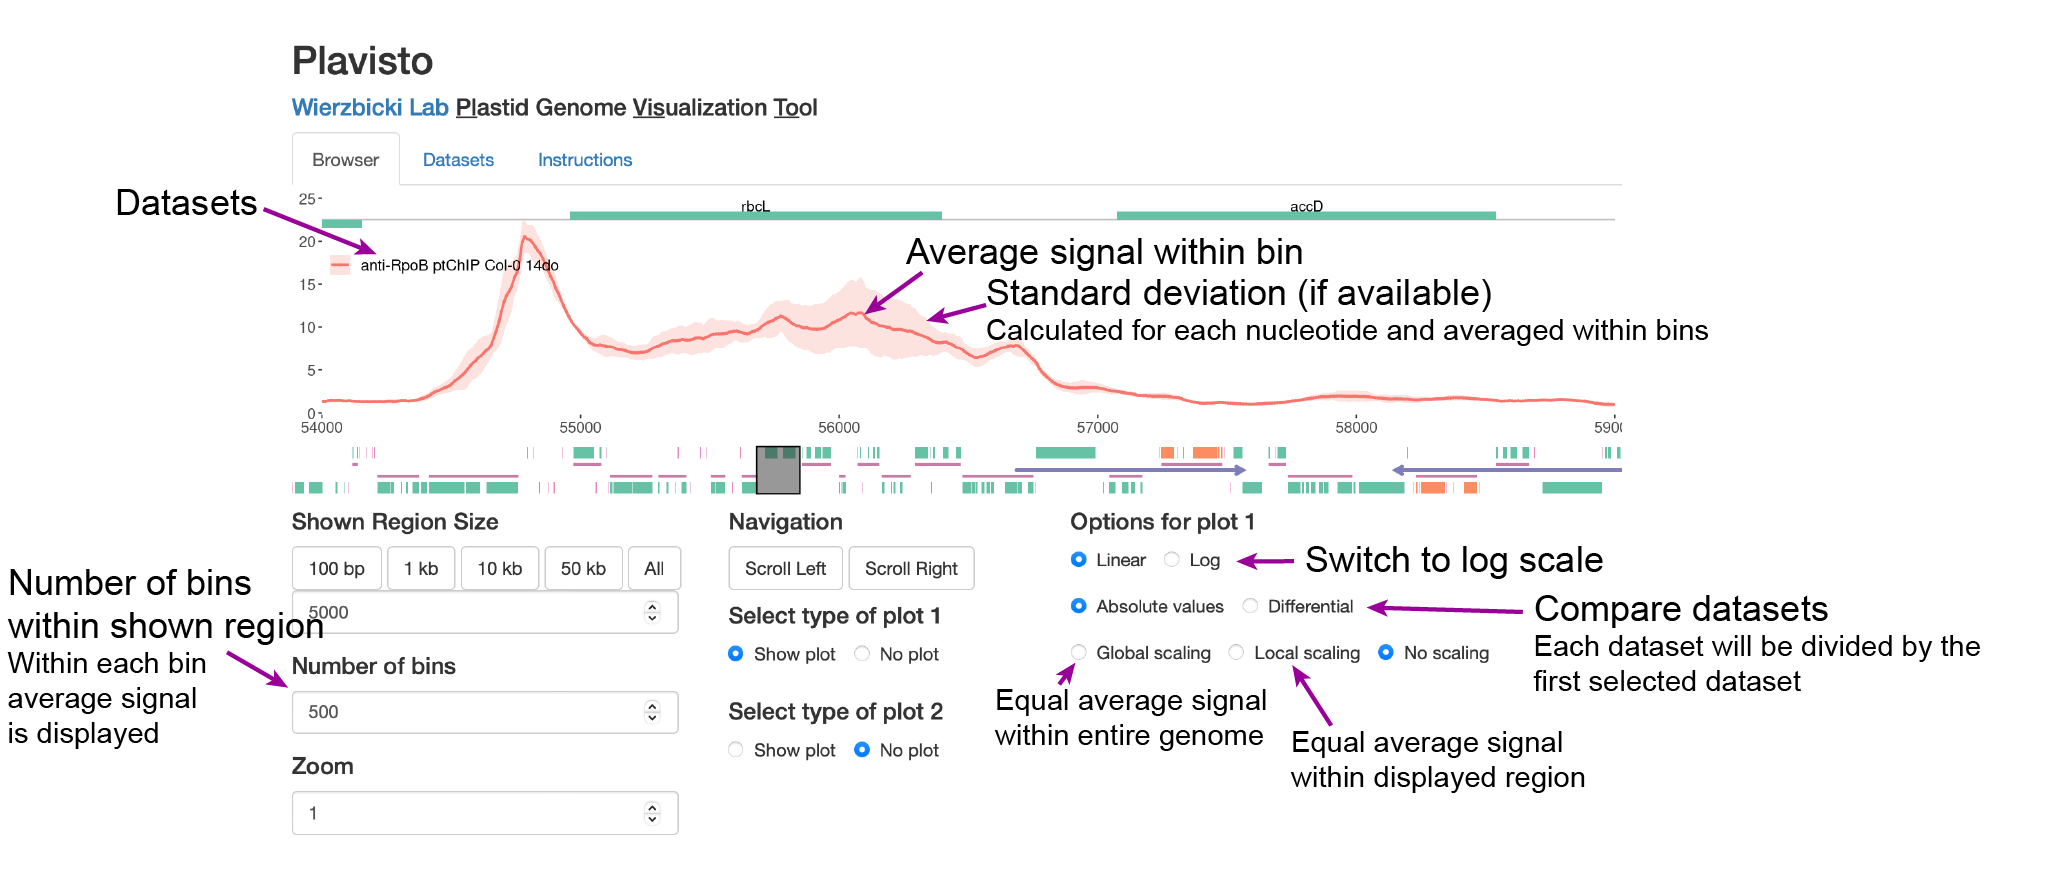
Shown Region Size
Number of bins
Zoom
Navigation
Select type of plot #1
Select type of plot #2
Select type of plot #3
Options for plot #1
Options for plot #2
Options for plot #3
Select datasets for Plot #1
Select datasets for Plot #2
Select datasets for Plot #3
Welcome to Plavisto v1.1, Plastid Genome Visualization Tool
Quick start
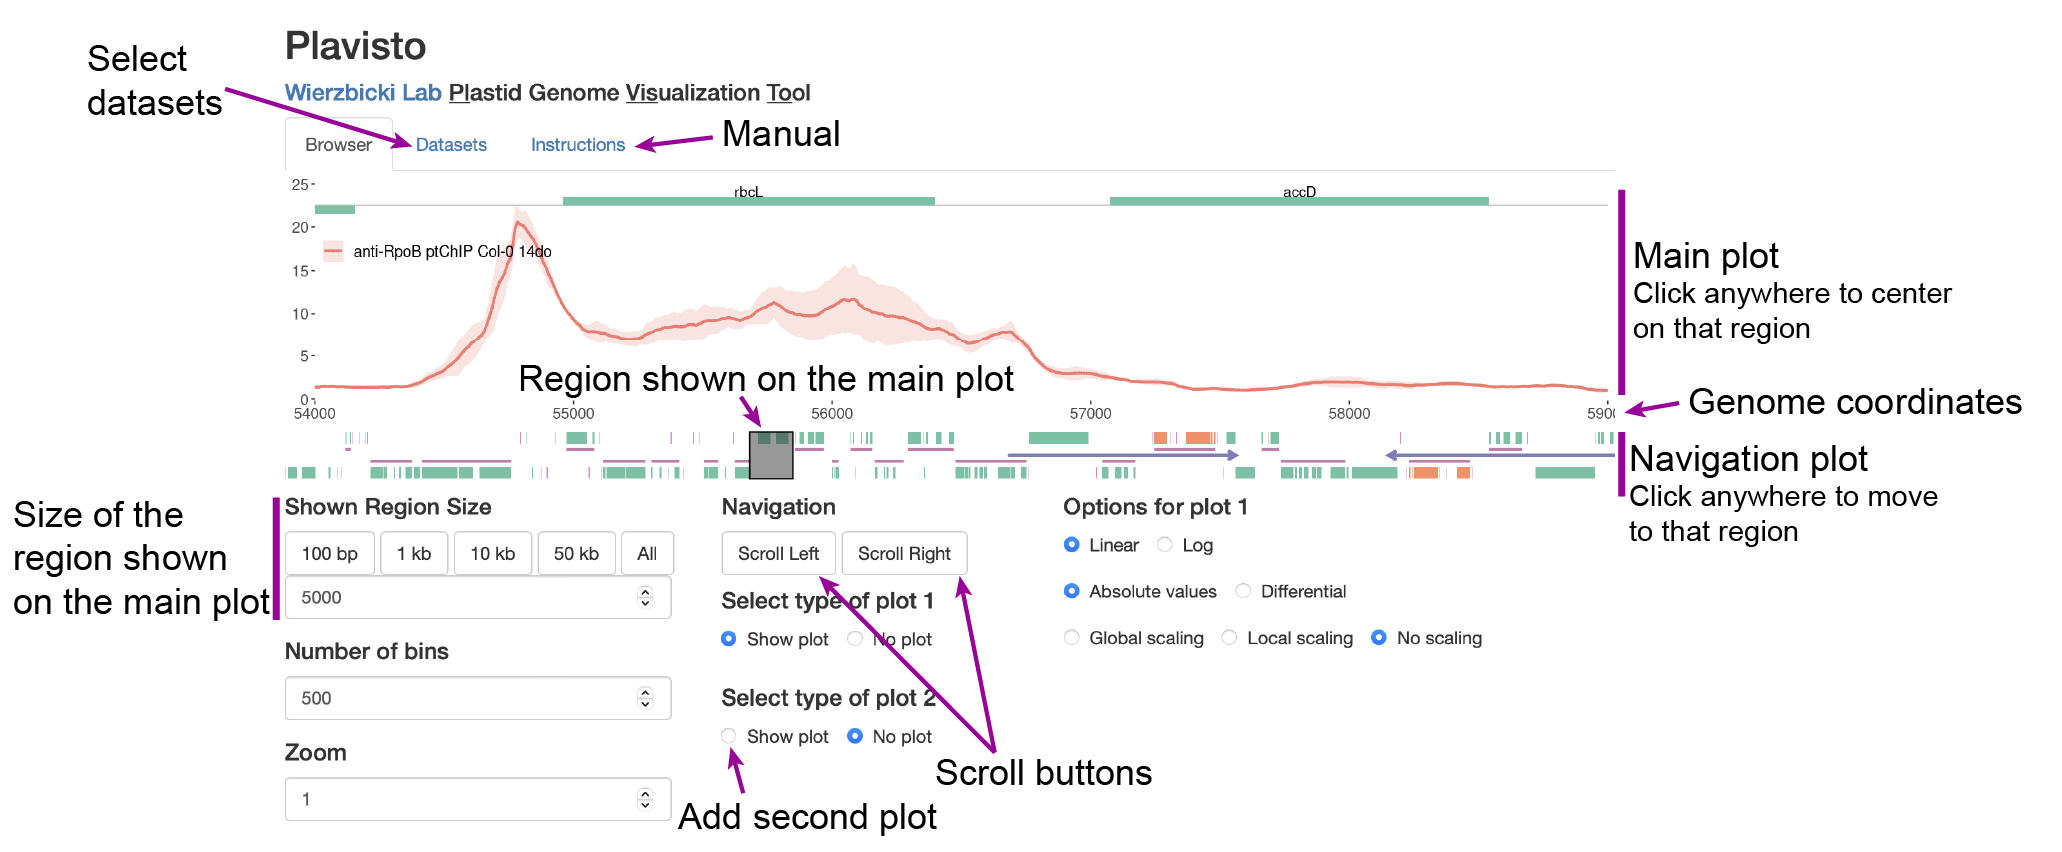
1. Access the browser - click on the "Browser" tab on top of the page.
2. Navigate within the plastid genome - click "Scroll Left" or "Scroll Right" in the middle of the "Browser" page or click anywhere within the main plot or within the navigation plot below.
3. Change length of the displayed fragment - change value in the "Shown Region Size" box or click on one of the buttons above the box.
4. Select more datasets - click on the "Datasets" tab on top of the page, navigate to the desired category and select one or more dataset.
Organism
Arabidopsis thaliana
Data sources
Palomar VM, Jaksich S, Fujii S, Kucinski J and Wierzbicki AT (2022) High-resolution map of plastid encoded polymerase binding patterns demonstrates a major role of transcription in chloroplast gene expression. Plant Journal 111:1139-1151; [Read article] [Access data in GEO]
Palomar VM, Fujii S, Rothi MH, Jaksich S, Coke AN and Wierzbicki AT (2023) Chloroplast nucleoid is organized by membrane association of transcribed genes. bioRxiv; [Read article] [Access data in GEO]
Contact us if you have proboems using Plavisto or would like to see your data included.
Author
Andrzej Wierzbicki [wierzbic@umich.edu] [website]
In collaboration with Miguel Palomar [vpalomar@umich.edu] [website]
Source code
https://github.com/wierzbic/Plavisto/
Navigation
Data display